Using Existing Submarine Cables as a Tsunami Warning Network
As published in the September Issue of SubTel Forum Magazine
 By Geoff Bennett
September 26, 2022
 By Geoff Bennett
A 2015 United Nations report estimated that every year, an average of 60,000 people and $4 billion USD in assets are exposed to the global tsunami hazard, which can be triggered by certain types of undersea earthquakes or volcanic eruptions. Many of us will remember the horrific events of Boxing Day 2004, when the Sumatra-Andaman undersea earthquake triggered a tsunami that resulted in the deaths of almost a quarter of a million people in 14 different countries.
The world has a number of different earthquake detection systems deployed or in development today:
- Land-based detectors are the backbone of seismic detection, but as the name suggests they can’t always be located close to potential seismic subsea zones.
- Ocean-based Deep-ocean Assessment and Reporting of Tsunamis (DART) buoys are an excellent solution, but there are very few of them, and they are frequently out of action because of harsh conditions or even vandalism.
- The SMART (Science Monitoring And Reliable Telecommunications) Cables initiative includes seismic, pressure, temperature, and acoustic sensors that can be installed in adapted subsea repeater modules, or even in separate dedicated modules along the cable. But the first such cable will only be ready in 2025, and the rollout of subsequent SMART Cables could be slow.
One of the obvious factors in early warning is that the closer a detector is to the epicenter, the earlier the warning can be to those in danger. For every 200 km the detector is from the epicenter, there is an additional one minute of delay for a potential warning of an impending tsunami.
The SubTel Forum database shows there are 444 submarine cables around the world today. What if we use the existing submarine cables, adding something to them that would allow them to be used as a detection network? While they may not be as capable as SMART Cables that are specifically designed for seismic detection, they have the benefit of being in place already.
The four criteria we need in such a detection system are:
- There must be something to measure at the end of the cable that is directly related to seismic activity somewhere along its length.
- Ideally, we need to be able to localize the source of the signal along the cable, since cables can be thousands of kilometers long.
- If we can reliably locate seismic events along a single cable, the location of the epicenter could be triangulated if measurements could be synchronized between multiple cables.
- We need to keep the incremental cost of deploying such a system to a minimum so that it becomes a no-brainer for a cable operator.
What Can We Measure?
Optical fibers are an engineering marvel – built to incredibly precise specifications and tolerances. But once they are deployed, they may be subjected to stresses that trigger certain optical impairments. If these stresses vary, like the movements of an undersea earthquake, then the impairments will vary along with them. Let’s look at some terminology.

Figure 1: Polarization and birefringence of light
The impairment in question in Figure 1 is the birefringence along the fiber path. As the figure shows, light propagates along the fiber in the Z axis and the electromagnetic field oscillates in two axes that are normal to the propagation path – let’s call them X and Y. When light is launched into any fiber, it will experience tiny variations in the refractive index experienced by each polarization axis, referred to as birefringence. When we apply this to optical data symbols, the different polarizations will result in a differential group delay (DGD) imposed on the symbol. While DGD is measured at a specific point in time, the polarization mode dispersion (PMD) of the fiber is the statistical average of the DGD along its entire length. Disturbances in the birefringence along the fiber path will result in changes in the state of polarization (SOP) for the light.
Modern coherent transponders must deal with these SOP variations in order to operate correctly, especially in older terrestrial fibers that may have been installed before the implications of pulling cables too hard was fully understood. When coherent transponders were first introduced, there were whimsical laboratory demonstrations of how the phase patterns of a transmission would vary if the researcher gently hit the fiber spool with a rubber hammer. The goal was to show how the receiver could adapt immediately to the birefringence disturbance caused by physical impact to the cable.
If we now apply this to a submarine cable, we can certainly measure how hard the receiver is working to deal with SOP changes, and this would be directly proportional to any physical disturbances along the cable. The result is that we can measure the instantaneous SOP for a given wavelength of light on the fiber. Modern coherent transponders will be constantly correcting for SOP variations, so it is perfectly possible to tap into this process and extract the data as telemetry into an external system. Note that I am referring to the idea of tapping into the compensation circuit for one or more live data wavelengths.

Figure 2: Ocean swell effects on SOP in the Curie cable Antonio Mecozzi et al., Optica Vol. 8, Issue 6, pp.
Figure 2 shows this for a real submarine cable – the Curie system that runs from Los Angeles, California in the U.S. to Valparaiso, Chile – a cable distance of just over 10,000 km. While the red zones are clear across a timespan of about six weeks, it’s extremely difficult to localize these signals to an area along the cable.
But this leads us to the next requirement because, as Figure 2 shows, measurements of in-service transponders represent the integration of any and all physical disturbances along the entire cable – which could be several thousand kilometers long. So, in addition to a substantial noise floor on the signal, it’s quite possible that physical disturbances, including seismic events, may be occurring in multiple places along the cable.
Is there a way that we could localize the closest point along the cable the physical disturbance is affecting? The answer could well be yes – thanks to a feature in most submarine repeaters.
Submarine Repeaters
Long-distance submarine cables include in-line repeaters that look like bulges along the cable. Typically, these are spaced every 55 to 80 km along the cable, and most of the repeaters deployed in existing cables include a diagnostic component called a fiber Bragg grating (FBG). The FBGs are tuned so that they reflect back somewhere less than 1% of a tight band of waves at about 1561 nm, known as a high-loss loopback (HLL) – note that, in contrast, a low-loss loopback would reflect back almost 100% of the light. The HLL wavelength is not a wavelength used for revenue-generating services because it loses around 1% of its power as it passes through each amplifier. While the amplifier boosts the signal it also boosts noise, so this is not an ideal wavelength for real data services.
In these cables, a diagnostic transmitter is tuned to 1561 nm and launched into the cable. The echoes from each repeater can be monitored, and this information can be used to detect fiber breaks along the cable, among other things. The precision is only as fine as the repeater spacing, which is not enough to direct a cable repair ship, but the diagnostic wavelength acts a rapid detection of a break, so that an optical time domain reflectometer (OTDR) device can be moved onto the fiber pair to more precisely locate the distance along the cable before the break.
A Diagnostic Transmitter

Figure 3: Diagnostic transponder and high-loss loopback (HLL)
Let’s assume we deploy our own diagnostic transmitter at one end of the cable as shown in Figure 3. Because 1561 nm is in the middle of the amplified band, the diagnostic pulse will be able to reach the end of the cable outbound, and the return pulses will also be amplified on their way back to the diagnostic transmitter. This aspect is critical because it allows SOP measurements to be taken along the entire cable.
We now send outbound pulses of light, shown in orange, and we see the return pulses, shown in dotted green, coming back in turn from each HLL element in the repeater. With current methods, the pulse rate has to be longer than the return time for the furthest repeater – otherwise adjacent pulses will overlap with echoes from the previous pulse. This is an important factor because the pulse frequency will limit the temporal resolution of the measurements. In a 10,000 km cable, for example, it would take a pulse around 50 ms to reach the furthest repeater and another 50 ms to return, thus limiting the pulse interval to no less than 100 ms. One approach to enhance the pulse frequency would be to send a series of pulses with slightly different wavelengths, but still within the return bandwidth of the high-loss loopback. Each echo would be on the original wavelength, so it would be possible to distinguish them and send new pulses before having to wait for the furthest pulse to return.
Interpreting the Echoes
So, what actually comes back to the diagnostic transmitter? Thanks to the HLL in each repeater, rather than a full integration of the signals from the full length of the cable, a pulse returning from repeater N will contain the integration of signals up to that point. Given that we also have the signals from repeaters 1 to N, we can “subtract” each signal mathematically until we have a return signal from repeater N, and the same can be done for each repeater along the cable. While this generates extremely interesting results, one way to make the process more robust would be to measure from both ends of the cable and combine the data to assist in isolating all the potential signal from an individual repeater span.
Real Earthquake Data
In February 2022, Infinera had the opportunity to test our seismic detection prototype on the Curie cable system. This is a seismically active area, with the Nazca tectonic plate running almost the whole length of Chile. On February 22 at 18:16 GMT, there was a magnitude 6 earthquake with its epicenter just over the border in Argentina, but at the intersection with Bolivia and Chile. Fortunately, there were no casualties, but this event provided an excellent opportunity to test the system.

Figure 4: Interpreting the data
The left side of Figure 4 shows the location of the epicenter (yellow star), and the locations of repeaters 90-110 in the Curie cable. The blue chart shows the signal from repeater 104, which showed the strongest signal. On the right of Figure 4 you can see the wave of the earthquake signal across a number of repeaters on Curie, with repeater 110 at the bottom and 90 and the top.
Global Detector Network
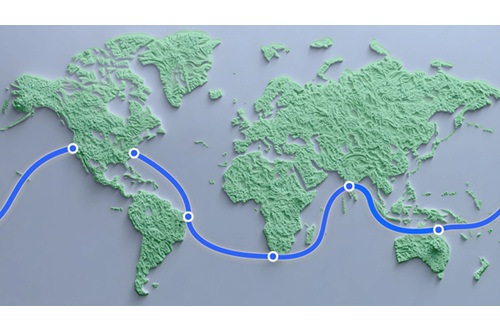
The remaining drawback in using a conventional subsea cable is that we have a single data point for the epicenter. However, Google’s original plan was to monitor data from multiple cables and to try to correlate it in order to triangulate an event location. For the moment, this is proving too challenging without the addition of the HLL approach to localize the signal along the cable length. But by combining the data from multiple cables, it may well be possible to zero in on an epicenter, as well as get a better idea of the magnitude of an event.

Figure 5: Combining the detection data over multiple cables
Figure 5 shows how that might happen with only four cables in the network and a seismic event just south of Hawaii. The yellow circles show the progress of a wave through the Earth’s crust – as you can see, it would impinge on each of the cables. I’ve shown these encounters multiple times along the cable, but the reality is somewhat more complex because of the way that seismic waves propagate through the crust. But the more measurement points, the higher the confidence in the data.
Cost Reduction Options
One of the best ways to ensure that more cables can take part in the sensor network is to minimize the incremental cost of deploying the necessary equipment. Let’s take a look at the options so far:
- Existing coherent transponders can stream SOP data from their receivers, which will result in an integration of signals from the entire cable length. To date, the industry has not found a way to use the HLL localization, even when combined with data from other cables.
- Dedicated equipment can be installed – like in the experiment conducted by the U.K.’s National Physical Laboratory and reported in the May 2022 edition of Science magazine. This test used a special, narrow-linewidth laser as the transmitter and a multi-channel frequency counter as a detector. This is somewhat expensive laboratory equipment but it could almost certainly be developed into a more cost-effective product. Even then, the high-specification components needed would mean it would be more expensive than conventional transponders.
- Part of the capacity of an in-service transponder could be used. This is the approach taken in Infinera’s trial with Google on the Curie cable. Let’s take a look at this approach in more detail.

Figure 6: ICE6 and the use of subcarriers as a diagnostic signal
Figure 6 shows the output from a single laser on Infinera’s ICE6 optical engine. One of the characteristics of this engine is that the laser carrier is divided into multiple Nyquist subcarriers using the digital signal processor (DSP) in the transmitter. The transmitter can generate four or eight subcarriers, depending on the configuration used. In this case we generate four subcarriers – three of them carry data as usual but the fourth is tuned into the HLL waveband and used as the diagnostic signal. Note that this fourth subcarrier looks narrower than the other three – in fact, the figure is not to scale, and it would be much narrower in real life. This is because it carries a tone pulse, as opposed to a modulated data signal. Using a tone allows for a much cleaner signal and avoids the need for DGD compensation.
With this approach, only a fraction of the capacity of a transponder is lost to the seismic detection technique, and this can significantly lower the cost of implementing the sensor function on a cable.
Conclusion
Using the hundreds of existing submarine cables as seismic detectors is a tempting proposition and would buy time for a new generation of dedicated SMART Cables to come into service. Infinera has shown that we can use a commercially available optical engine to simultaneously carry revenue-generating traffic and provide a detector signal. The low incremental cost of this technology could enable cable operators to join a worldwide network of seismic sensors.
About the Author
Geoff Bennett is the Director of Solutions & Technology for Infinera, a leading manufacturer of Intelligent Transport Network Solutions. He has over 25 years of experience in the data communications industry, including IP routing with Proteon and Wellfleet; ATM and MLPS experience with FORE systems; and optical transmission and switching experience with Marconi, where he held the position of Distinguished Engineer in the CTO Office. Geoff is a frequent conference speaker and is the author of “Designing TCP/IP Internetworks”, published by VNR
Click here to read more articles from the Offshore Energy Issue of SubTel Forum Magazine or read on our archive site here.
news via inbox
Sign up to get the latest updates straight to your inbox!